Double Deconvolution
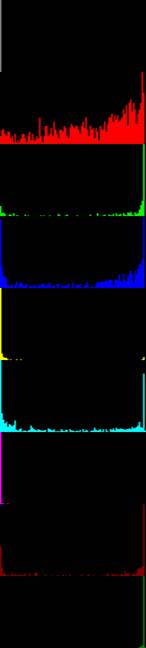
The 1st pass of deconvolution is to sort patches by their cancer probabilities. Table 1 compares our approach with traditional DNNs.
|
|
Deconvolution #1 |
Traditional |
Traditional-Best in literature |
|
adipose |
|
|
|
|
background |
|||
|
debris |
|||
|
lymphocytes |
|||
|
mucus |
|||
|
smooth muscle |
|||
|
normal colon mucosa |
|||
|
cancer-associated stroma |
|||
|
colorectal adenocarcinoma epithelium |
Table 1
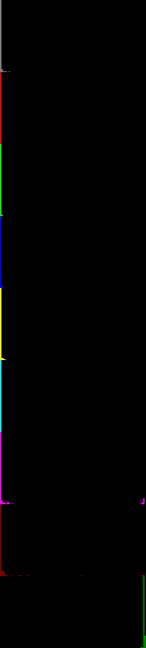
The 2nd pass of deconvolution splits patches into groups B and C and then narrows down cancer probability distribution of group B patches. As Table 2 shows, cancer probability distributions of different tissue types inside group B no longer overlap.
|
|
Deconvolution #1 |
Deconvolution
#2 Group B |
Deconvolution
#2 Group C |
|
adipose |
|
|
|
|
background |
|||
|
debris |
|||
|
lymphocytes |
|||
|
mucus |
|||
|
smooth muscle |
|||
|
normal colon mucosa |
|||
|
cancer-associated stroma |
|||
|
colorectal adenocarcinoma epithelium |
Table 2
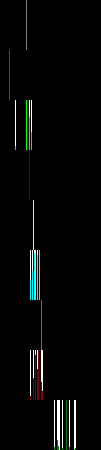
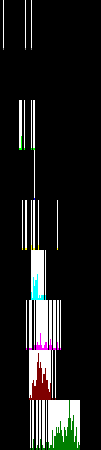
Table 3 illustrates application of the double deconvolution technology to 4 whole slide images of specimens suspected of colorectal tumors. The first 2 are negative cases and the last 2 are positive cases according to the pathologists who made the diagnoses, and the double deconvolution are consistent with human doctor's diagnoses. Note the shape of group C distribution, asymmetry (with large side lobe on the right) indicates cancers too, besides the hint from group B.
|
B |
C |
|||||
|
Distribution |
Patches |
Probability |
Distribution |
Patches |
Probability |
|
|
403668 |
|
15387 |
21% |
|
1637 |
16% |
|
041717172507 |
|
12080 |
30% |
|
5170 |
15% |
|
041730593781 |
|
14880 |
41% |
|
6609 |
25% |
|
240366843437 |
|
13864 |
36% |
|
7528 |
26% |
Table 3
To make a diagnosis, all that is needed is a few slides with (correct) diagnoses. The double deconvolution technology works directly from these slides and doesn't require training over (large amount of) data.
The input to the double deconvolution pipeline is whole slide images. The output is a few videos, images and plain text documents. Videos are made from patch images sorted according to cancer probability. Doctors don't need to be trained to learn the software or to interpret the output of all the compute.